Published Story Map

Assessing Catastrophic Landslide Risk in Zimbabwe: Building Resilience in the Wake of Cyclone Idai

The 2019 Tropical Cyclone Idai delivered extreme winds and heavy rainfall to Zimbabwe, triggering devastating secondary hazards, most notably extensive landslides and debris-rich flooding in the vulnerable districts of Chimanimani and Chipinge. Although often neglected as a direct consequence of climate change, these landslides caused the loss of hundreds of lives, destroyed critical infrastructure, and impacted over 270,000 people.

In response to this catastrophe, the UNESCO Regional Office for Southern Africa (ROSA) collaborated with local and international experts to conduct a comprehensive landslide risk assessment, aimed at developing sustainable risk mitigation and disaster management actions to build community resilience. The study successfully mapped and modeled the spatial distribution of 14,900 Idai-related landslides and associated debris-rich floods, categorizing them into landslide source/depletion zones, runout areas, and debris-rich floods. This technical approach utilized remote sensing validated by field missions and models to create high-resolution susceptibility and exposure maps.

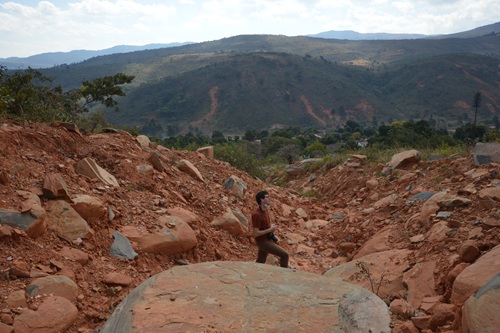
The analysis revealed that Chimanimani district contains the majority of landslide hotspots. Landslide occurrence is driven by geological factors, including deeply weathered dolerites, mudstones and siltstones, and numerous geological weaknesses such as thrusts and faults, which were exploited by the intense rainfall. Furthermore, human activities, including road cuttings, mining, and the development of settlements on unstable slopes and alluvial plains, significantly increase the overall risk to population and infrastructure in these high-susceptibility zones (e.g., Ngangu and Kopa).

This report provides a vital tool for preventative adaptation policies. Recognizing the increased frequency of hazards under climate variability scenarios, it strongly recommends measures such as enhanced land-use planning, slope stabilization, and the capacitation and potential resettlement of communities to reduce risk. The lessons learned from this comprehensive study in Zimbabwe are designed to be applicable to other vulnerable, data-scarce regions across Africa and worldwide.

Scroll to explore the story — the visualizations update as you read.

Loading scene…
1

The 2019 Cyclone Idai

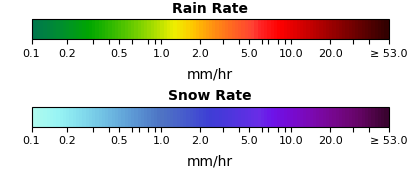
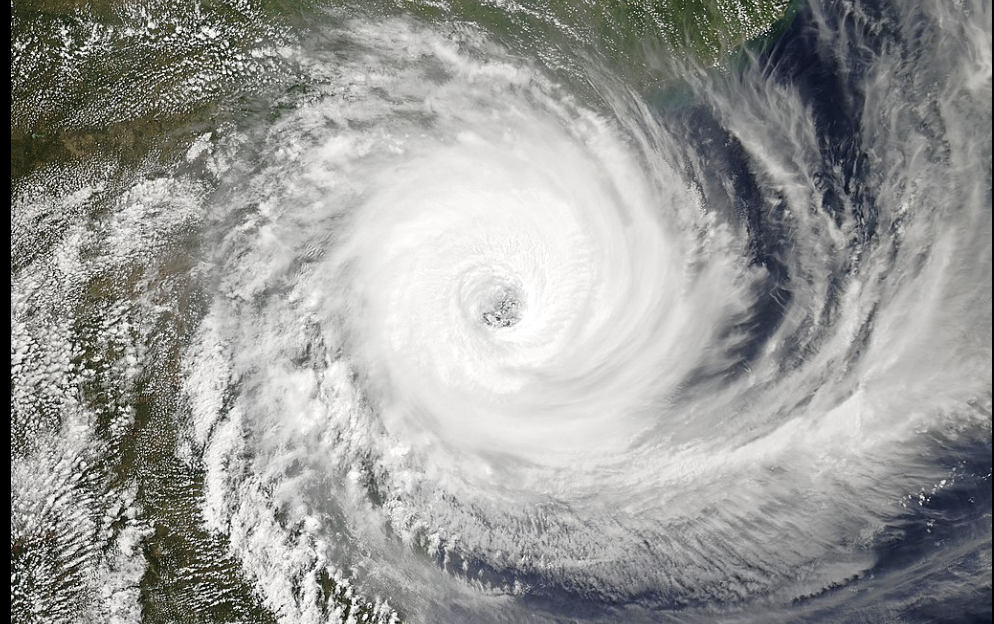
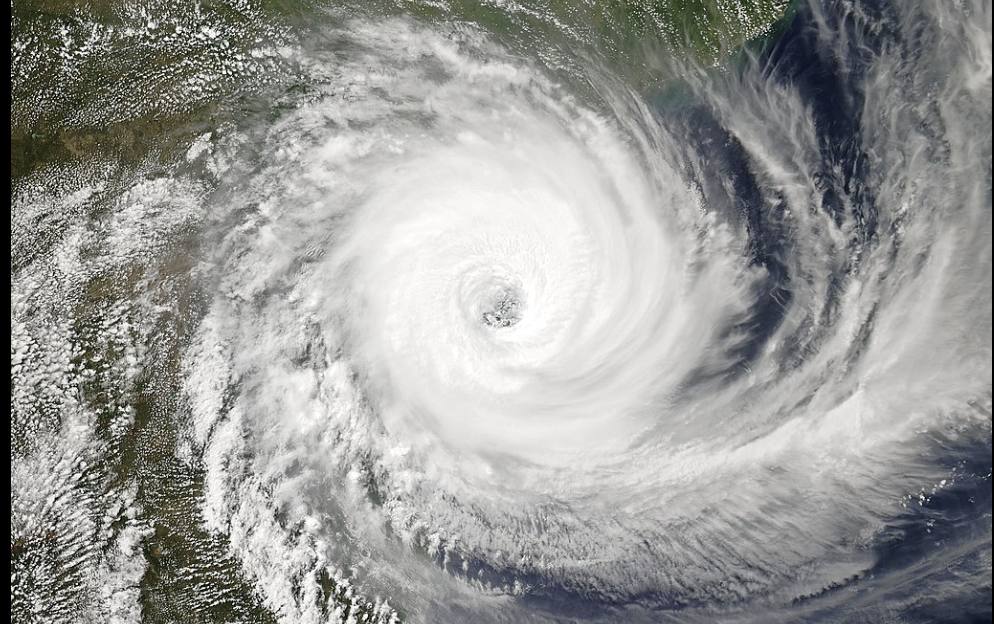
Cyclone Idai ranks among the deadliest 95 storms ever recorded in the southern hemisphere (Devi, 2019). In March 2019, it caused widespread flooding across Mozambique, Malawi, and Zimbabwe, resulting in thousands of fatalities and affecting over three million people – many already in need of humanitarian assistance (Chatiza, 2019). In eastern Zimbabwe, the extreme rainfall (300–450 mm between 15–19 March– nearly half the region’s annual average of ~1000 mm; IMERG-GPM satellite 100 estimates (Huffman et al., 2019)) triggered thousands of highly mobile landslides that severely impacted mountain communities in the Chimanimani and Chipinge districts (e.g., Chatiza, 2019; Chanza et al., 2020).

1/1 Cyclone Idai Rainfall - 14 March 2019

Open this map in Terria

2

Landslide impacts of Cyclone Idai

Cyclone Idai triggered over 10 000 landslides, with most landslides occurring in eastern Chimanimani, which is more mountainous and received higher rainfall totals during the Cyclone overpass (330 mm on average).
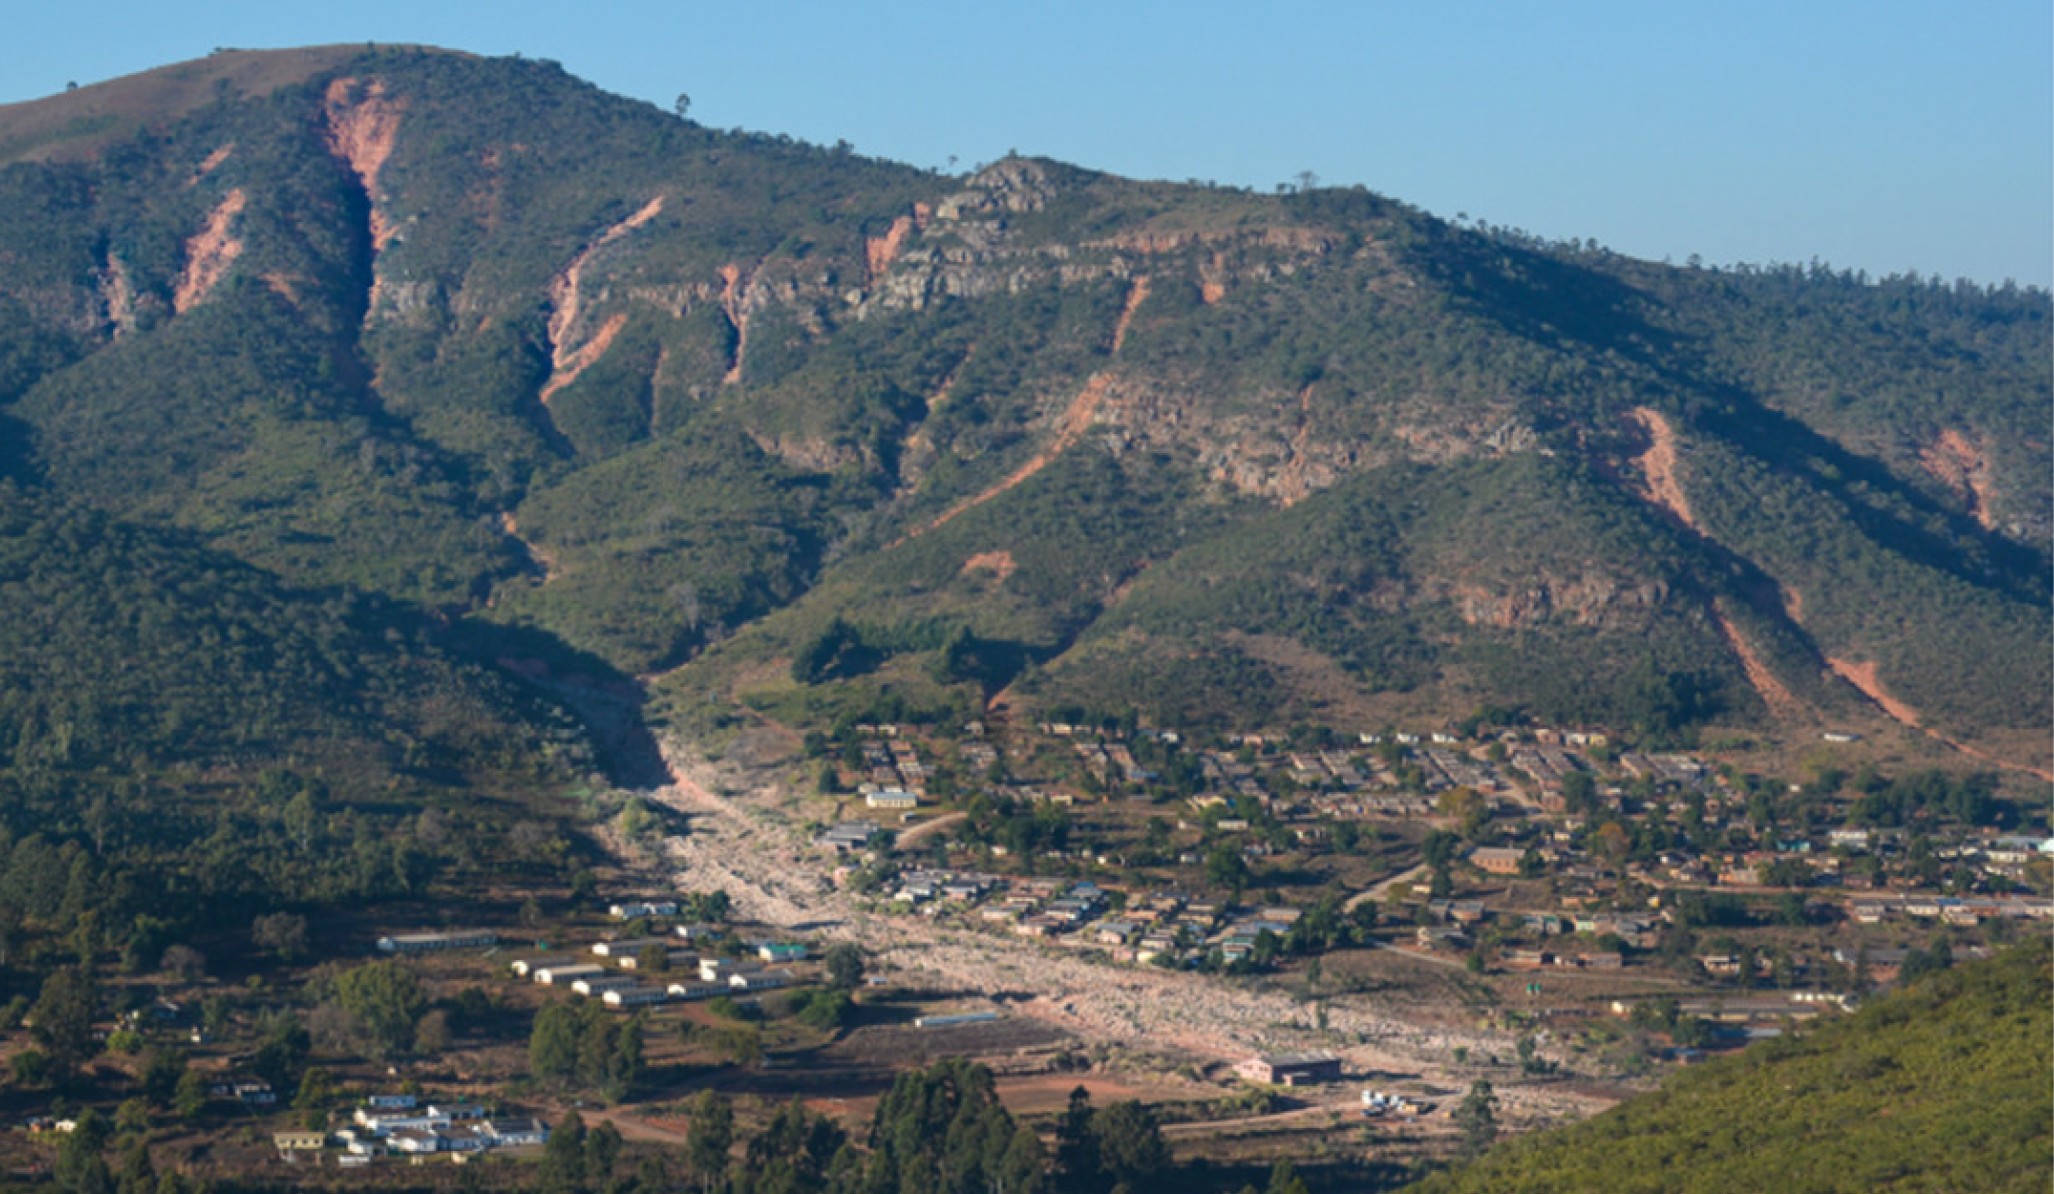

UNESCO, in collaboration with the University of Leuven (KULeuven), the Flemish Research Institute for Technology (VITO) and the GeoRisk research department of the Africa Museum initiated a rigorous landslide assessment, documenting landslides through remote sensing and validating by field work.


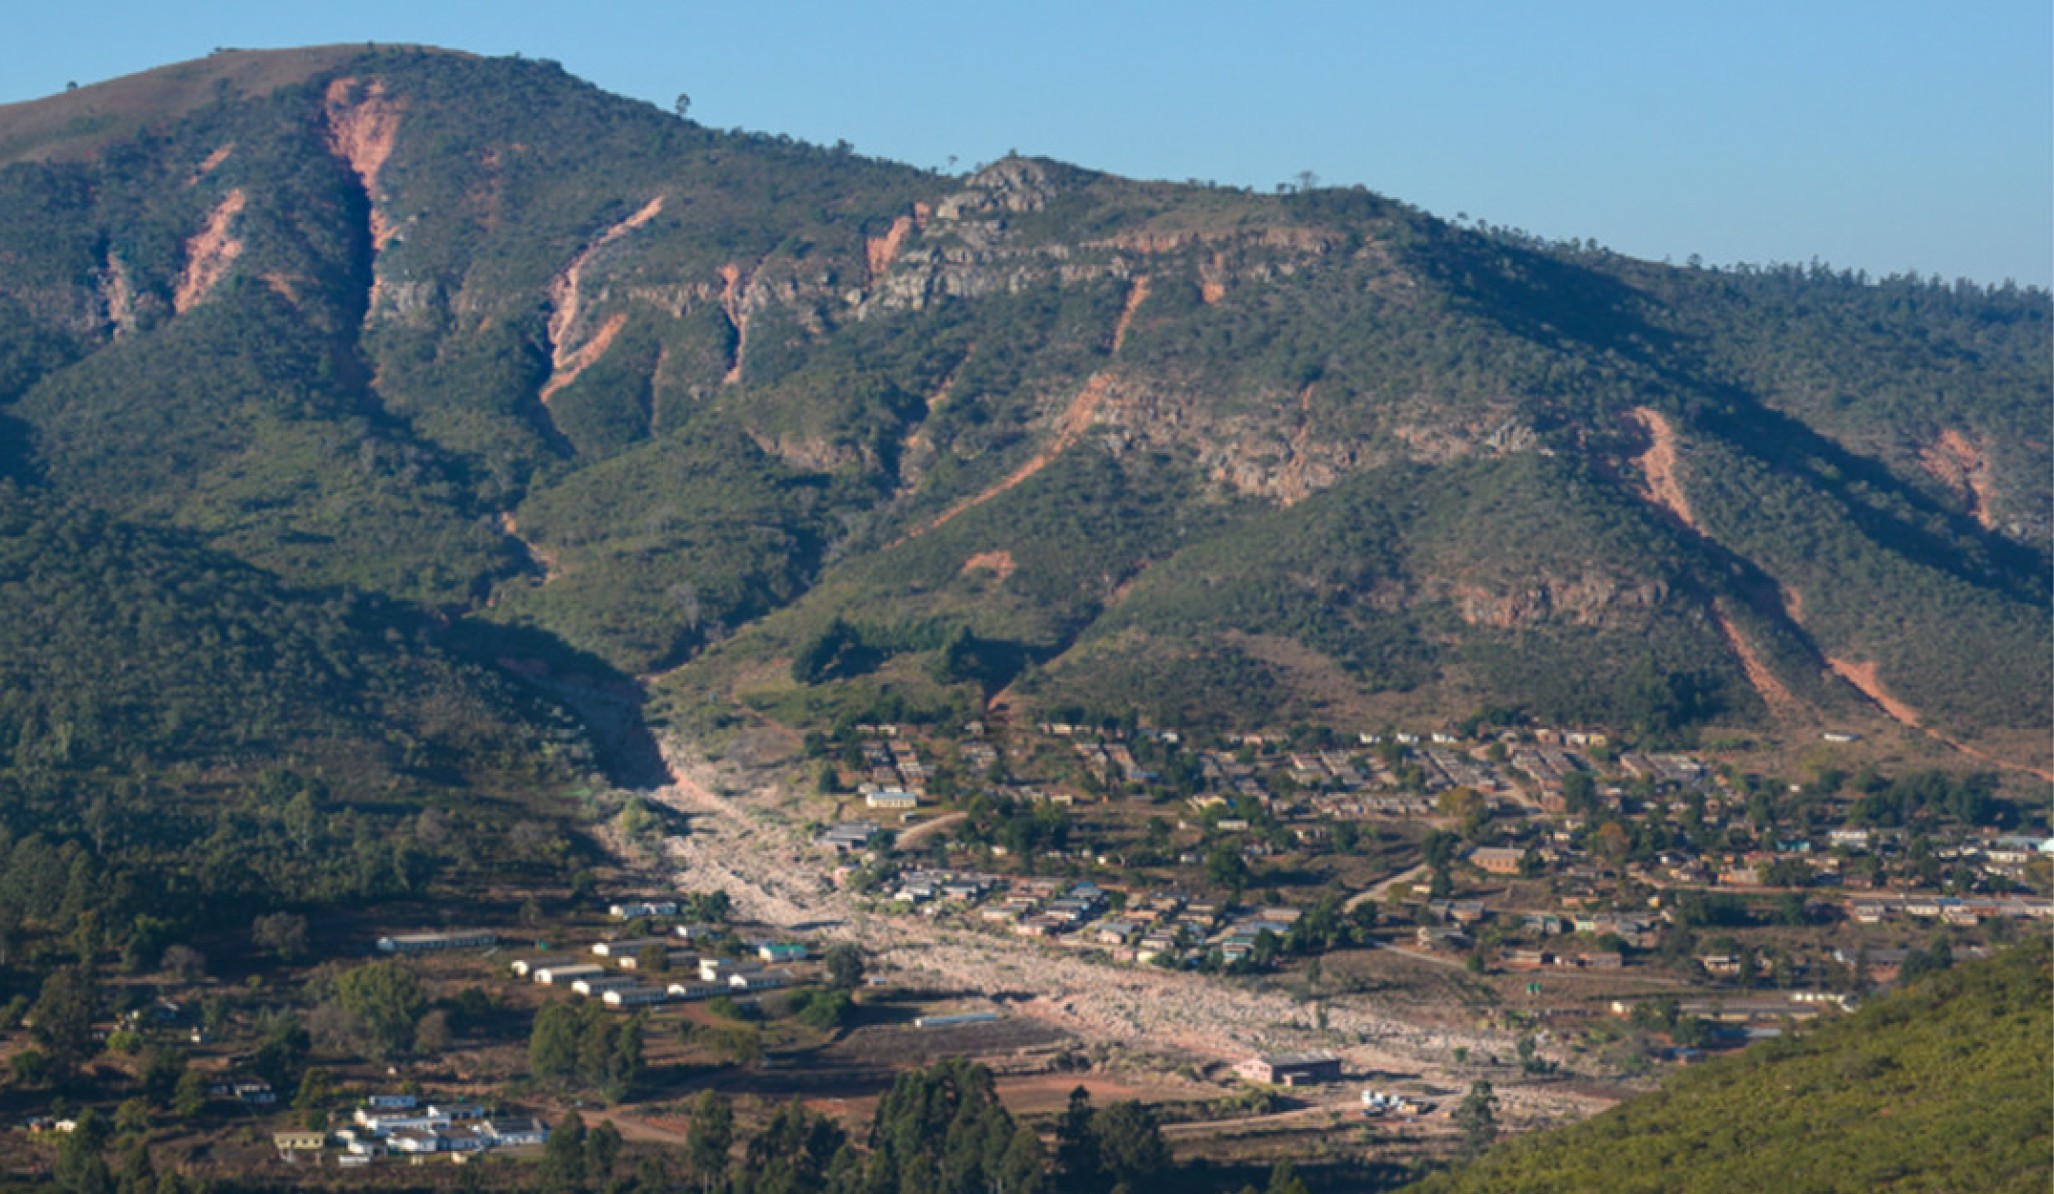
The maps below present the extent and impact of the landslides, both in source areas of sediments, as well as extended landslide runouts that cut across houses and villages and the subsequent debris flow and floods that affects a large area of the two Districts, affecting thousands of people downstream.


The infographic presents the different elements of landslide impact observed during the Cyclone Idai overpass.
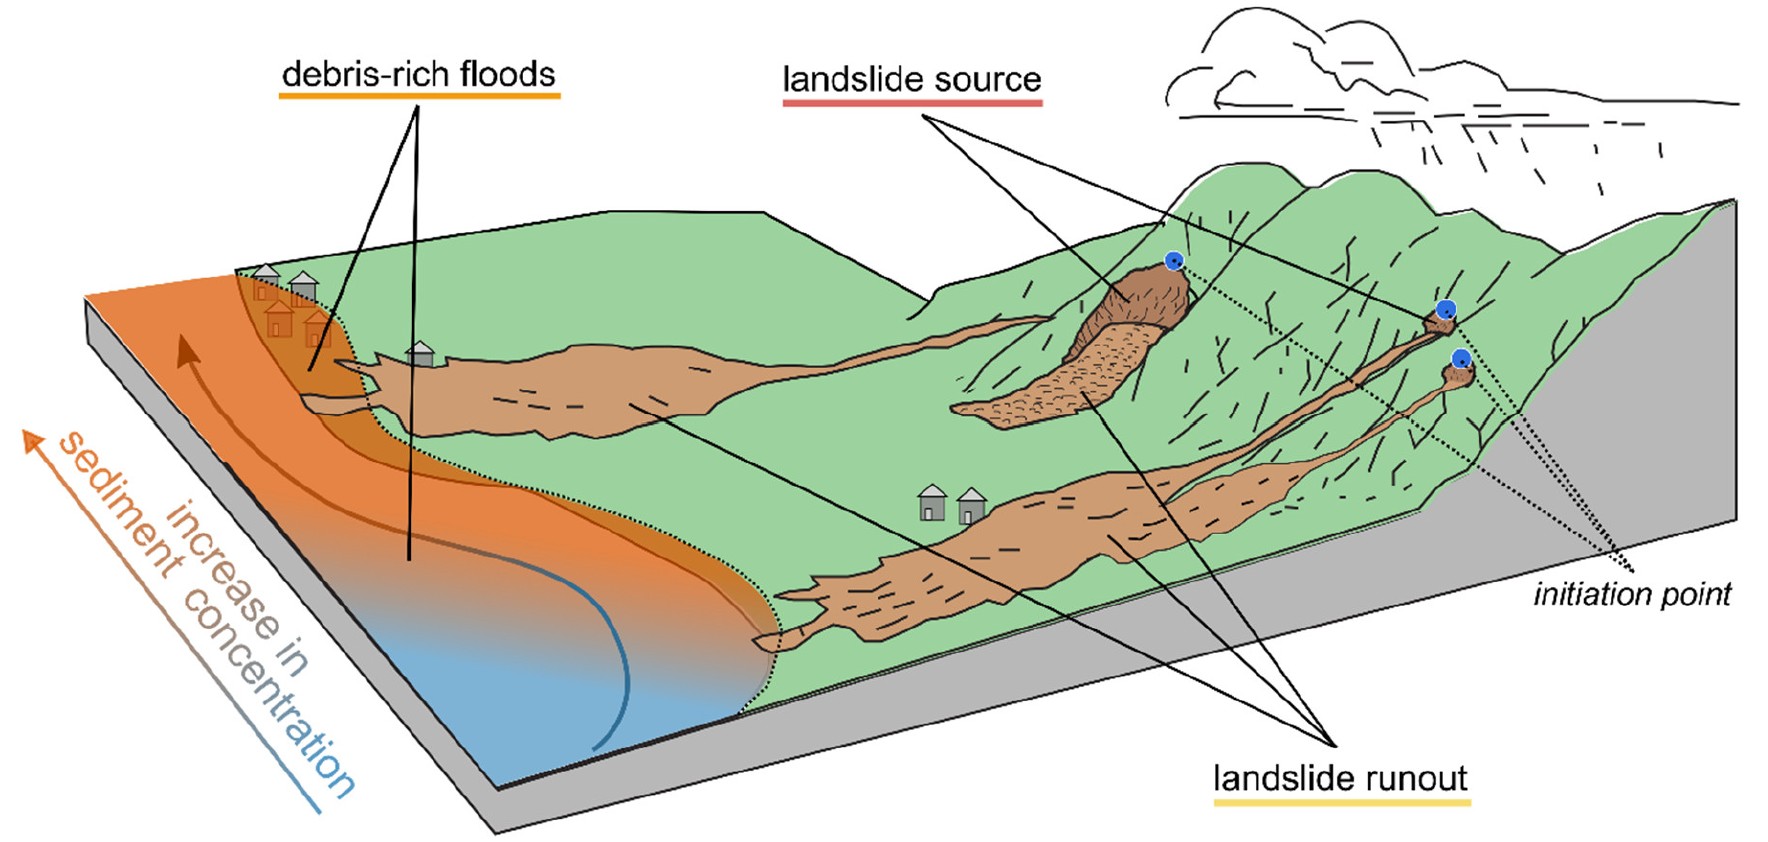
Figure 1. Illustration and definition of the landslide classification, showing landslide source, landslide runout, and associated debris-rich flood zones as mapped in this case study. Adapted from Highland and Bobrowsky (2008).

Landslide Assessment in Chimanimani District

1/2 Landslides affecting Chimanimani and Chipinge

Overview of the landslides that affected the Chimanimani and Chipinge Districts, showing the landslide origin (blue dot) and the debris-floods across the river basin (red lines)

2/2 Landslides affecting Chimanimani District

Detailed zoom on Ngangu Township, Chimanimani, showing the classification of landslide source areas (red), runout (yellow), and debris-rich floods (orange) originating from the landslides.

Open this map in Terria

3

Landslide and Flood Risk Assessment of Schools

The second part of the case study focused on assessing the vulnerability and risk of the Districts to current and future landslides. Therefore, a landslide susceptibility map was developed to identify the areas potentially at risk of landslides, their runouts or the subsequent debris flows and floods using modelling techniques. This allowed to identify potential areas at risk, and particularly schools, health facilities and roads. In the following maps, an overview of the landslide risks can be identified.

1/4 Susceptibility Map

This map present the overall susceptibility of the Districts to landslides, its runouts and subsequent debris-rich floods. It shows a higher susceptibility in the eastern, northern parts of teh two Districts.


2/4 Susceptibility to landslide source areas

This map shows the susceptibility to landslide source areas across the two districts.


3/4 Susceptibility to landslide runouts

This map shows the susceptibility of the area to landslide runouts.

4/4 Susceptibility to debris-flows and floods

This map shows the susceptibility to the subsequent debris-flows and floods originating from landslide source areas.

1/7 Overview of Flood Risk and School Locations

This map provides a view of primary and secondary schools in Chimanimani and Chipinge Districts, overlaid with flood their yearly flood probabilities. The legend indicates flood return periods, showing the probability of inundation affecting the schools for any given return period.

2/7 Schools in the Chimanimani and Chipinge Districts

This view displays the locations of all mapped primary and secondary schools within Chimanimani and Chipinge. These locations form the basis of the flood impact analysis.

3/7 Schools at Risk – 1000-Year Return Period

Schools shown here in yellow are exposed to extreme flood events with a return period of 1 in 1000 years. These rare events represent the highest-magnitude, lowest-probability floods.

4/7 Schools at Risk – 500 to 250-Year Return Period

This slide highlights schools vulnerable to floods with a 1 in 250 to 500-year probability. Though uncommon, such events can cause significant disruption if they occur.

5/7 Schools at Risk – 100 to 200-Year Return Period

This slide focuses on schools within zones prone to 100 to 200-year floods, a standard benchmark in flood risk management for infrastructure planning.

6/7 Schools at Risk – 10 to 50-Year Return Period

Displayed are schools exposed to flood events with a 1 in 10-year probability, relatively frequent and likely to affect educational continuity if unmitigated.

7/7 Schools at Risk – Less Than 5-Year Return Period

This final slide shows schools highly vulnerable to very frequent floods, with return periods of less than 5 years. These sites face recurrent disruptions and require urgent attention.

1/1 Landslide Susceptibility of Health Facilities

This map shows the landslide susceptibility of health facilities in the two Districts, combining the different impacts from the landslides. The legend presents the different levels of susceptibility.

1/1 Landslide Susceptibility of secondary schools

This map shows the landslide susceptibility of secondary schools in the two districts.

Open this map in Terria

Research Publication

Dille, A., Dewitte, O., Broeckx, J., Verbist, K., Sindiso Dube, A., Poesen, J., Vanmaercke, M. (2026). Capturing the complete landslide–debris-rich flood continuum for accurate inventory, susceptibility and exposure mapping – lessons from Cyclone Idai. https://doi.org/10.5194/nhess-26-2561-2026

DOI: 10.5194/nhess-26-2561-2026 View Paper

Datasets

Primary

Landslide Susceptibility and Exposure Assesment — Chimanimani and Chipinge districts, Zimbabwe

This dataset contains layers for manuscript 'Capturing the complete landslide–debris-rich flood continuum for accurate inventory, susceptibility...

Image Gallery